Introduction
While k6 is useful as a standalone load testing tool, integrating it with external logging tools enhances its usability.
Particularly during load testing, it’s important for testing efficiency to monitor whether the load test is running correctly and to stop the test immediately if any abnormalities are detected.
In this article, I’ll introduce how to integrate k6 with Datadog to send metrics to Datadog during k6 execution.
For those who want to see the conclusion, please refer to the following PR:
PR: https://github.com/gonkunkun/k6-template/pull/6
Prerequisites
The prerequisites for this article are as follows:
- Docker environment already set up
- k6 already installed
- Go environment already set up
Steps
First, let’s obtain a Datadog API key.
For this example, we’ll register for a trial.
First, go to the Datadog website.
datadog: https://www.datadoghq.com/ja/
Select "Start Free Trial."

Enter the required information.
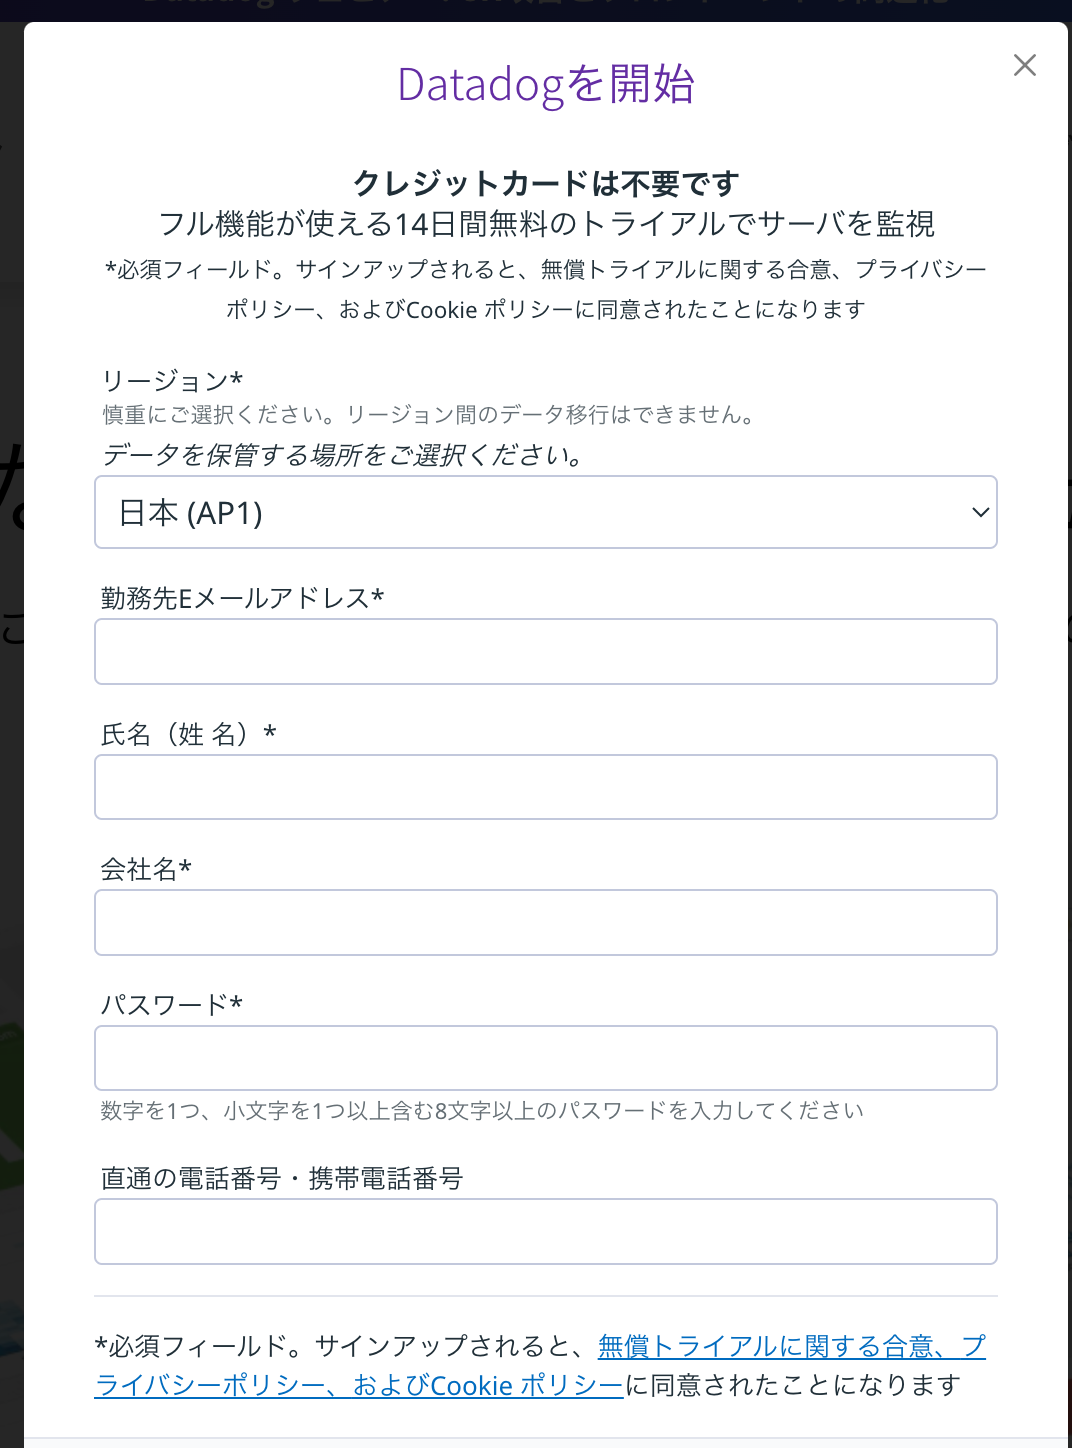
Select Docker as the usage environment.
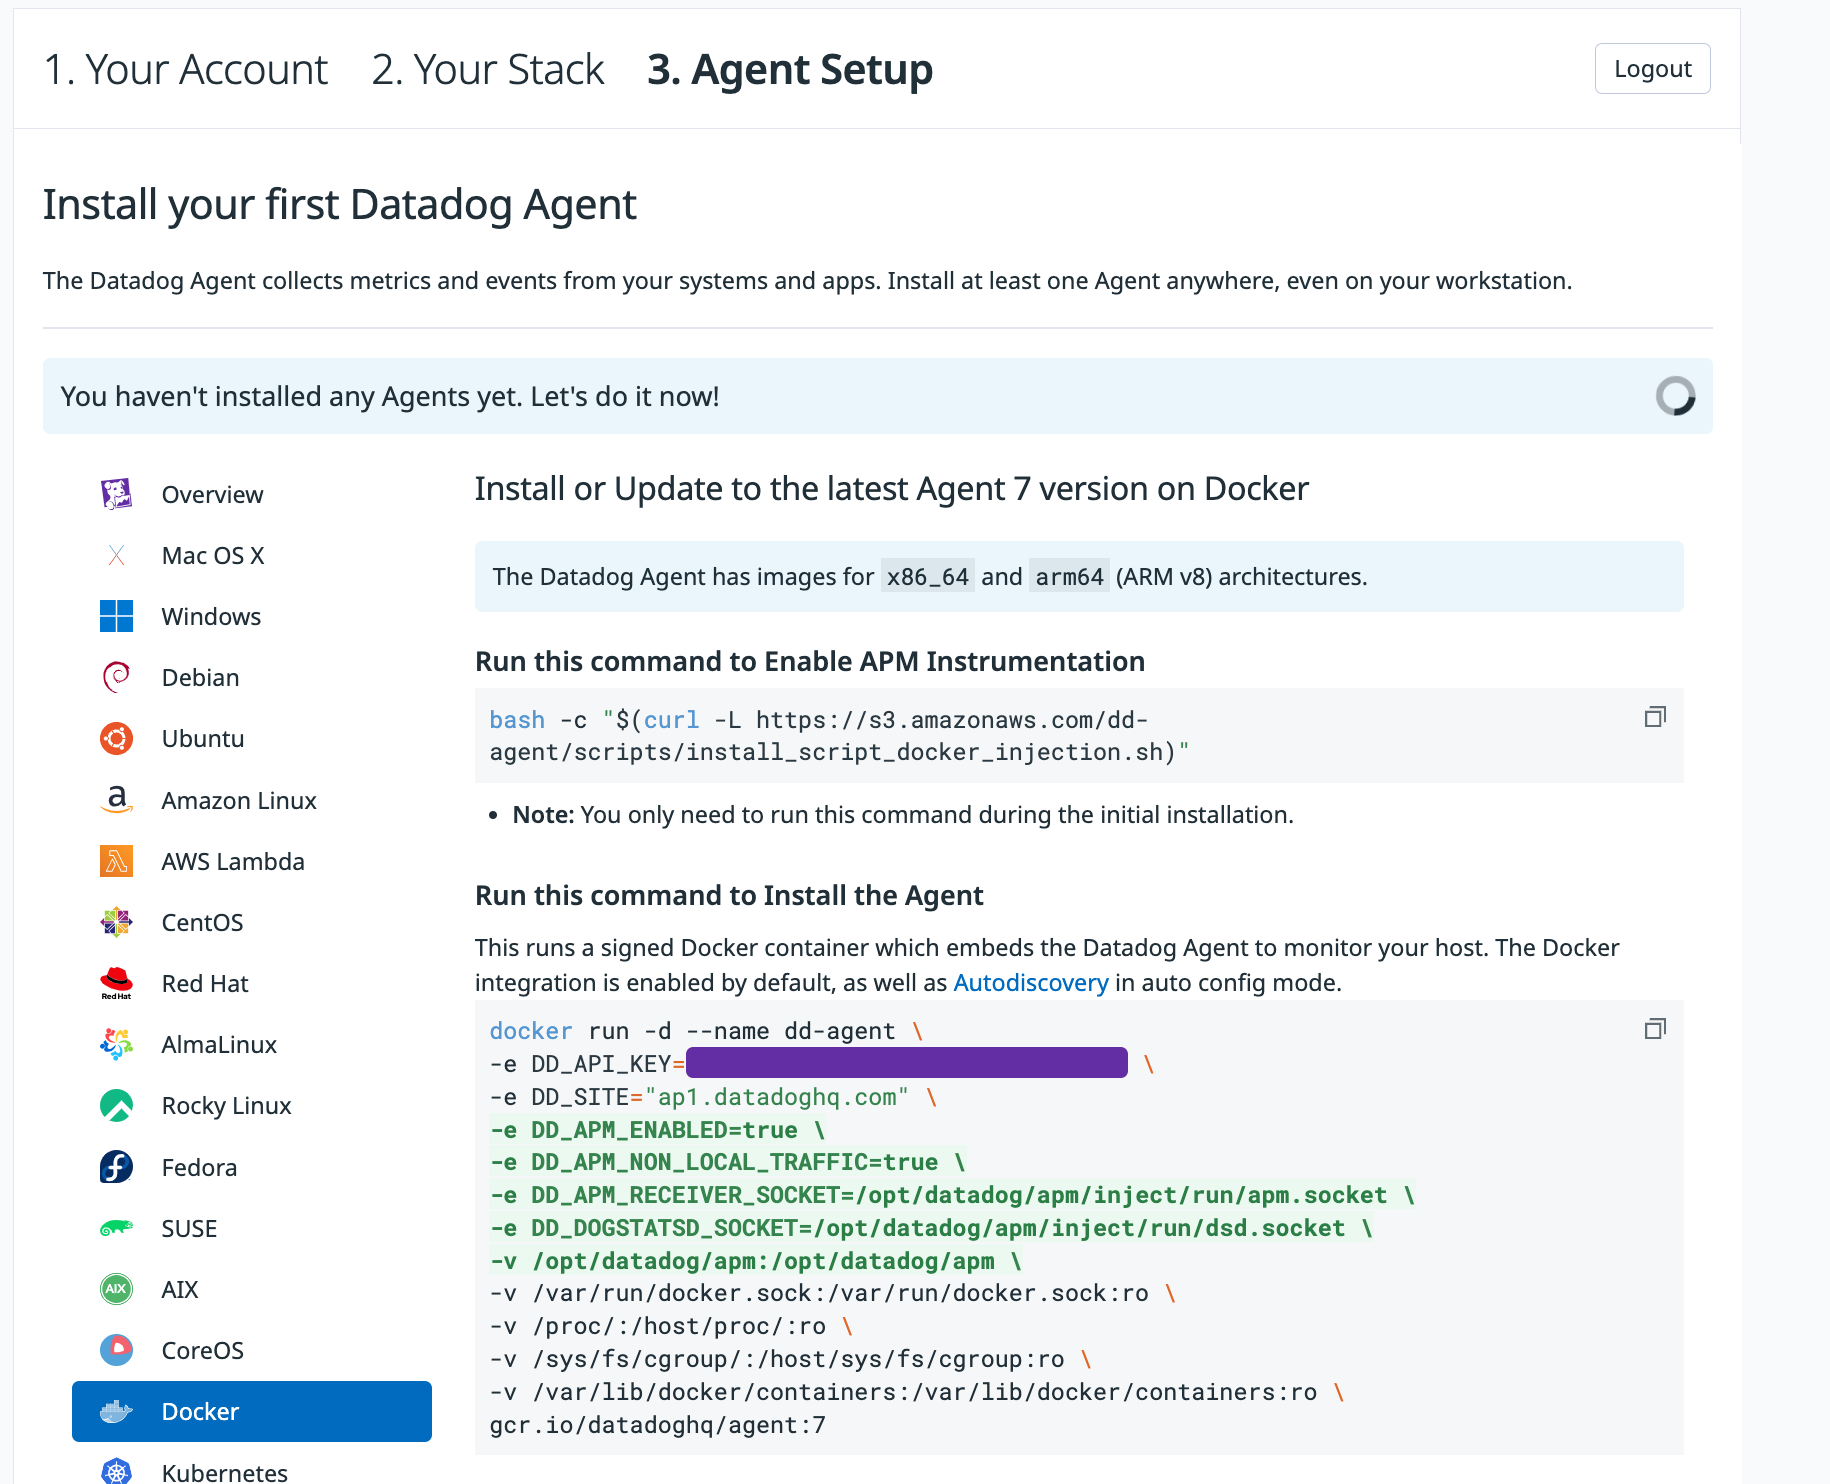
Follow the instructions to start the Datadog agent.
~/D/g/template-of-k6 ❯❯❯ docker run -d --name dd-agent                                                                                           main
-e DD_API_KEY=xxxxx
-e DD_SITE="ap1.datadoghq.com"
-e DD_APM_ENABLED=true
-e DD_APM_NON_LOCAL_TRAFFIC=true
-e DD_APM_RECEIVER_SOCKET=/opt/datadog/apm/inject/run/apm.socket
-e DD_DOGSTATSD_SOCKET=/opt/datadog/apm/inject/run/dsd.socket
-v /opt/datadog/apm:/opt/datadog/apm
-v /var/run/docker.sock:/var/run/docker.sock:ro
-v /proc/:/host/proc/:ro
-v /sys/fs/cgroup/:/host/sys/fs/cgroup:ro
-v /var/lib/docker/containers:/var/lib/docker/containers:ro
gcr.io/datadoghq/agent:7
fc6fa398a85a1b8000a3d8bfea2ea1e2b3b4fb98a1f5ccc46f84dfe9af9091e3
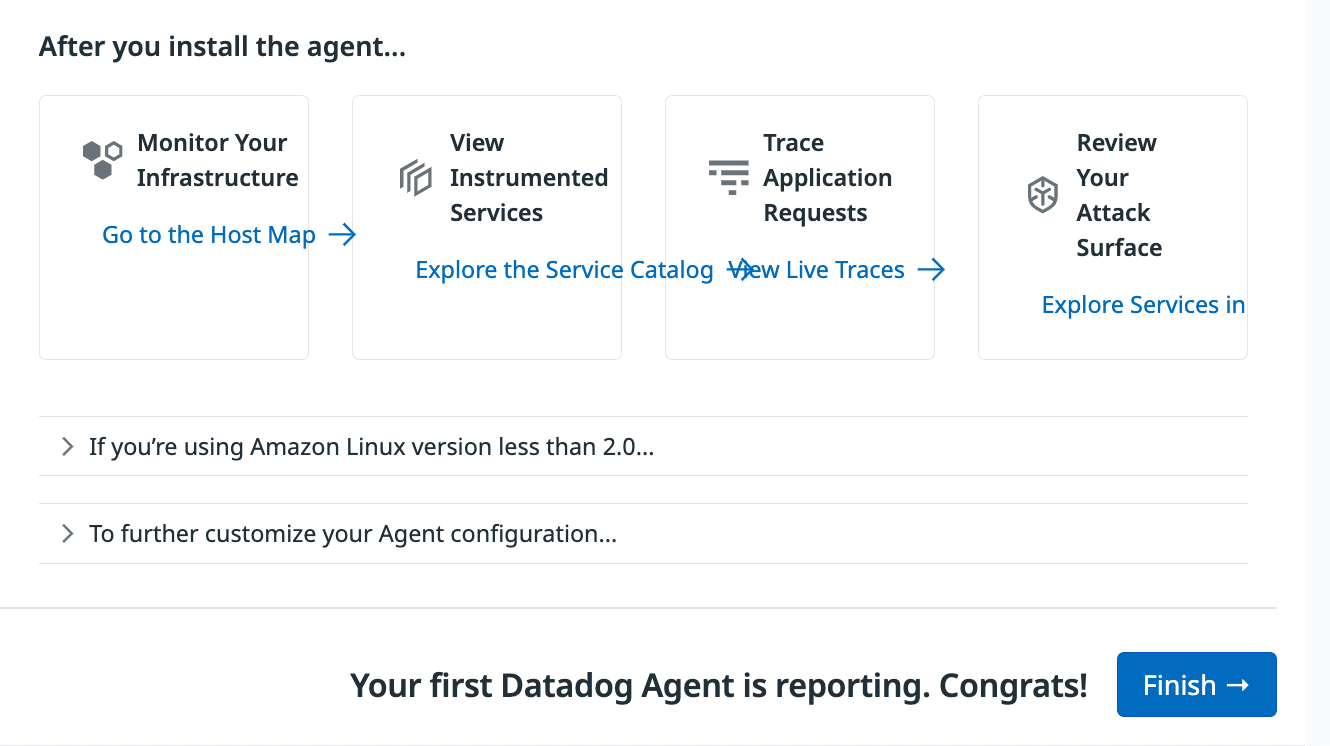
Once you confirm that Datadog is receiving data from the Datadog agent, the tutorial is complete.
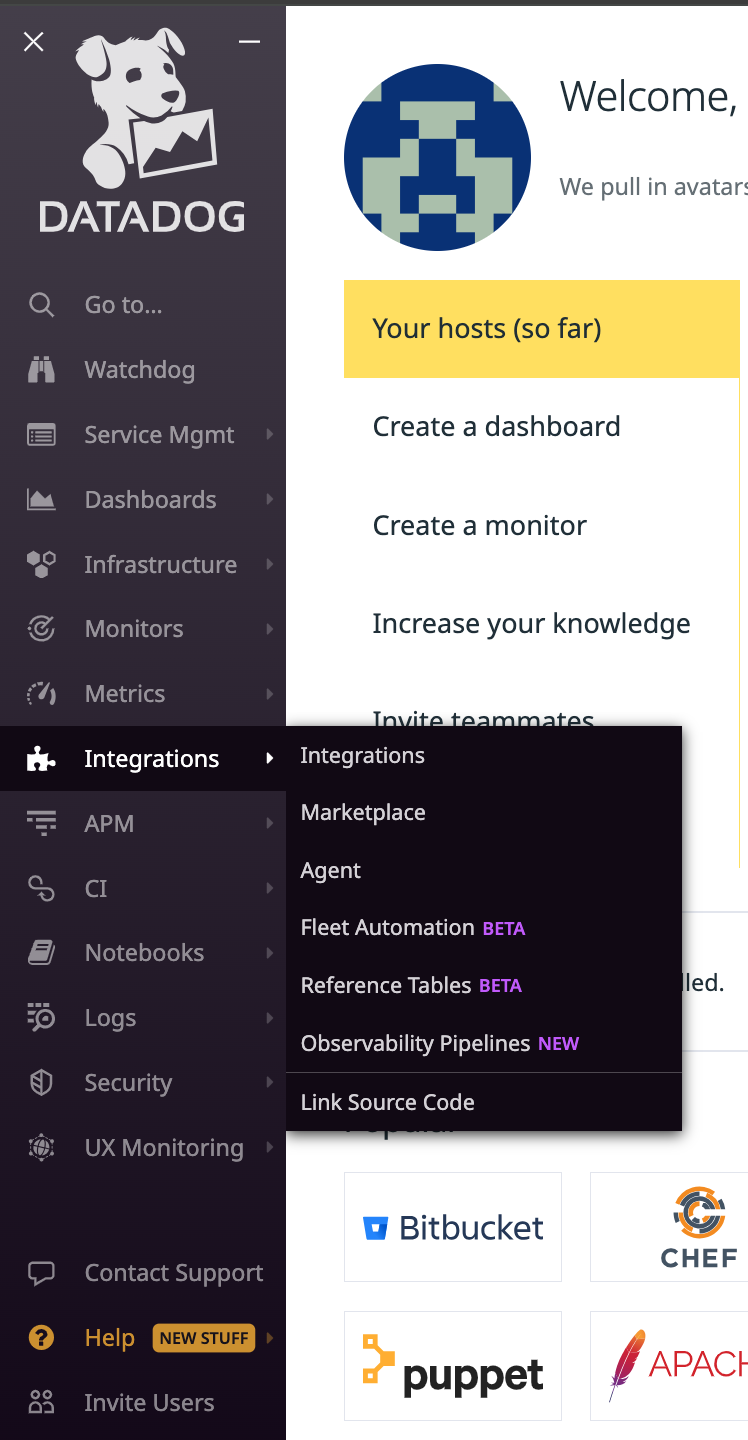
From Integration, install the k6 Integration.
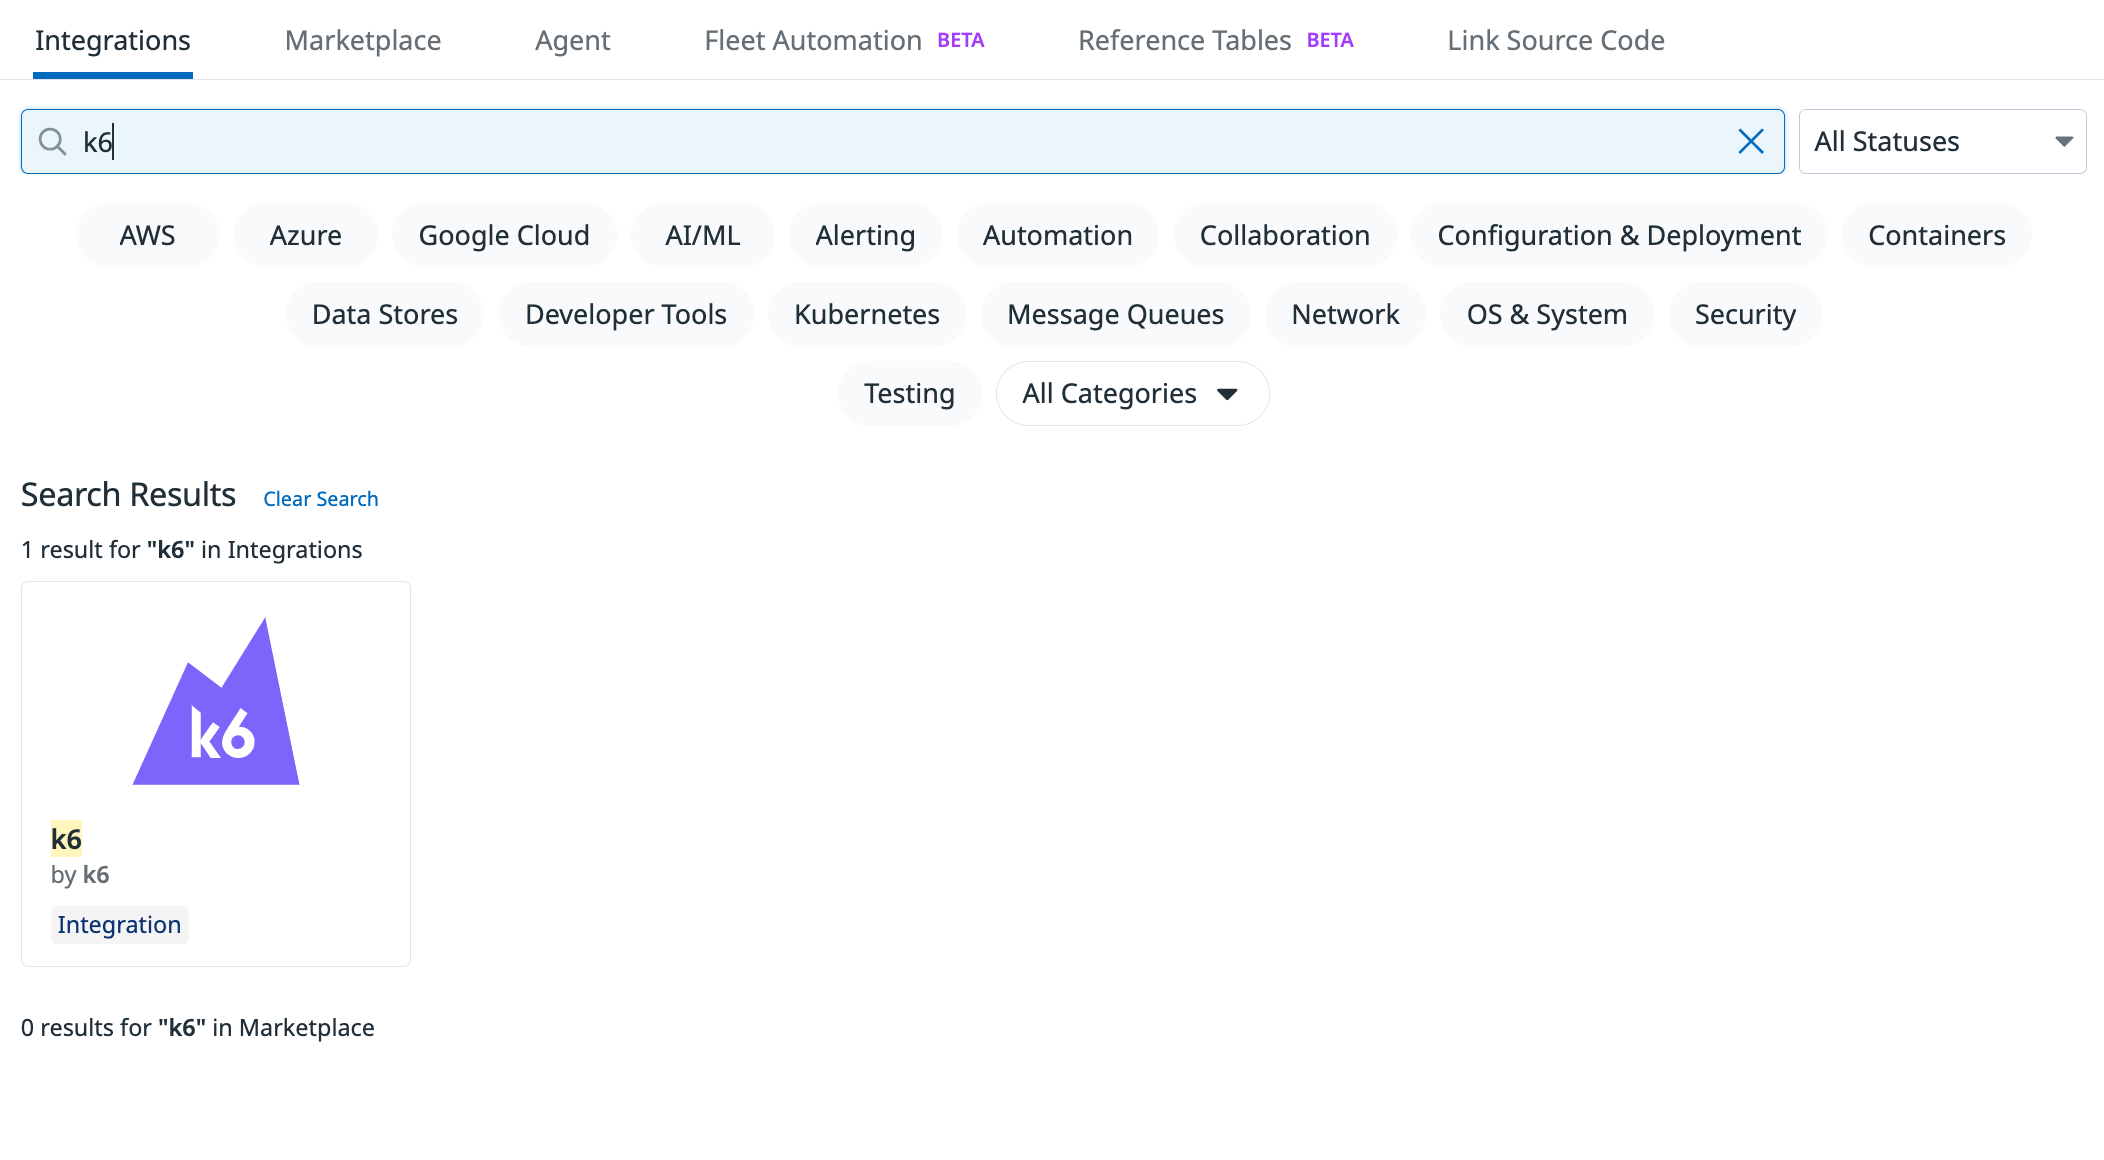
Search for k6.
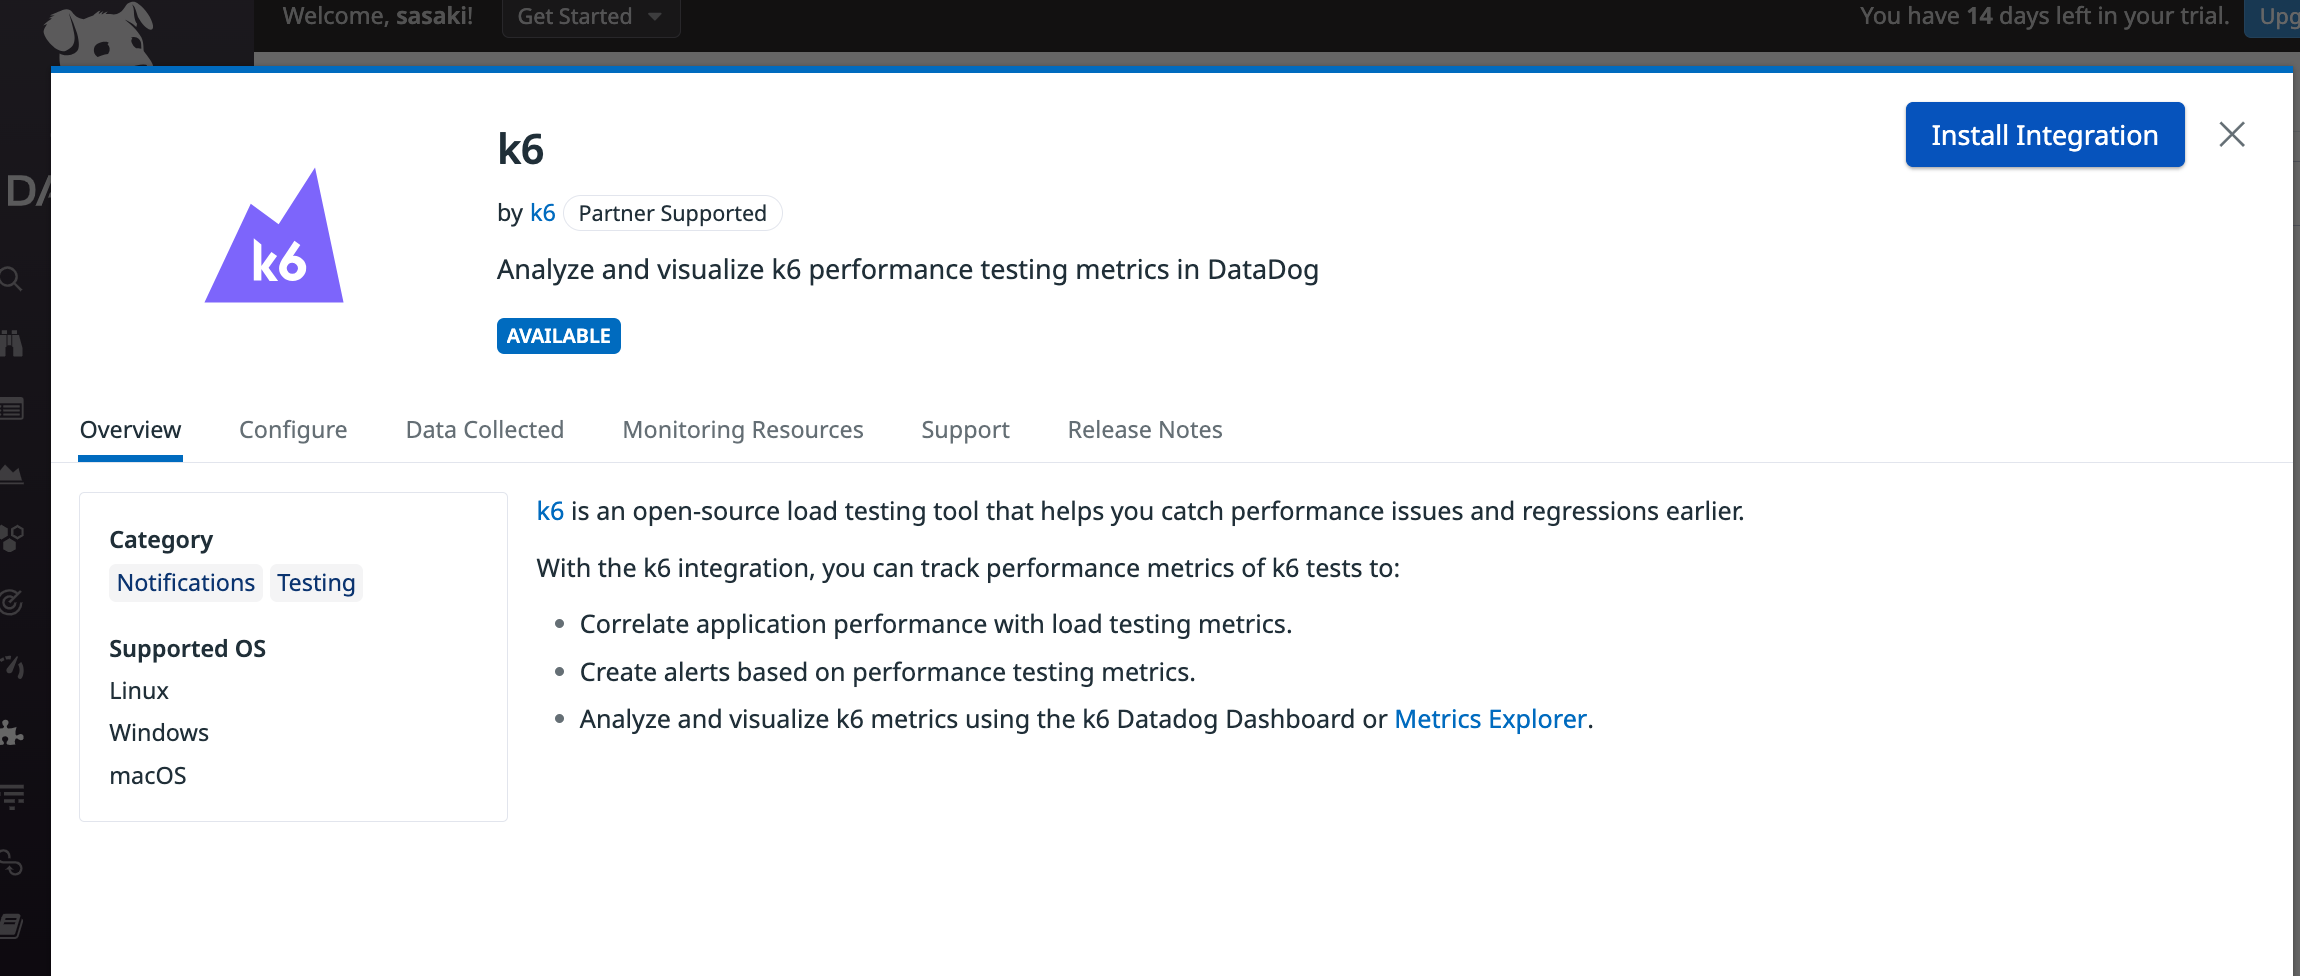
Select Install integration.
Then, follow the displayed instructions to restart the Datadog agent.
~/D/g/template-of-k6 ❯❯❯ DOCKER_CONTENT_TRUST=1                                                                                              ✘ 1 main
docker run -d
    --name datadog
    -v /var/run/docker.sock:/var/run/docker.sock:ro
    -v /proc/:/host/proc/:ro
    -v /sys/fs/cgroup/:/host/sys/fs/cgroup:ro
    -e DD_SITE="ap1.datadoghq.com"
    -e DD_API_KEY=${DD_API_KEY}
    -e DD_DOGSTATSD_NON_LOCAL_TRAFFIC=1
    -p 8125:8125/udp
    datadog/agent:latest
Confirm that the Datadog agent is running.
~/D/g/template-of-k6 ❯❯❯ docker ps                                                                                                                main
CONTAINER ID   IMAGE                      COMMAND                CREATED          STATUS                    PORTS                NAMES
fc6fa398a85a   gcr.io/datadoghq/agent:7   "/bin/entrypoint.sh"   43 seconds ago   Up 41 seconds (healthy)   8125/udp, 8126/tcp   dd-agent
The logs look good too.
~/D/g/template-of-k6 ❯❯❯ docker logs -f datadog                                                                                                   main
[s6-init] making user provided files available at /var/run/s6/etc...exited 0.
[s6-init] ensuring user provided files have correct perms...exited 0.
[fix-attrs.d] applying ownership & permissions fixes...
...
Now, let’s configure k6.
The xk6-output-statsd extension is essential.
Let’s build the k6 command.
If you don’t have the xk6 command, refer to the following article for installation:
https://gonkunblog.com/k6-use-xk6-dotenv/2040/
xk6 build
--with github.com/LeonAdato/xk6-output-statsd@latest
--with github.com/grafana/xk6-dashboard@latest
--with github.com/szkiba/xk6-ts@latest
--with github.com/szkiba/xk6-dotenv@latest
Add environment variables and options to the execution command to send metrics via the Datadog agent during k6 execution.
Reference: https://grafana.com/docs/k6/latest/results-output/real-time/datadog/
~/D/g/template-of-k6 ❯❯❯ K6_STATSD_ENABLE_TAGS=true XK6_TS=false ./k6 run ./dist/loadTest.js --out output-statsd -e CONFIG_PATH=../src/sample-product/configs/smoke.json

          /      |‾‾| /‾‾/   /‾‾/
     /  /       |  |/  /   /  /
    /  /        |     (   /   ‾‾
   /             |  |   |  (‾)  |
  / __________   |__| __ _____/ .io

  execution: local
     script: ./dist/loadTest.js
     output: statsd (localhost:8125)

  scenarios: (100.00%) 2 scenarios, 2 max VUs, 1m30s max duration (incl. graceful stop):
           * sampleScenario1: 1 iterations for each of 1 VUs (maxDuration: 1m0s, exec: sampleScenario1, gracefulStop: 30s)
           * sampleScenario2: 1 iterations for each of 1 VUs (maxDuration: 1m0s, exec: sampleScenario2, gracefulStop: 30s)

INFO[0001] 0se: == setup() BEGIN ===========================================================  source=console
INFO[0001] 0se: Start of test: 2024-04-07 14:24:34       source=console
INFO[0001] 0se: Test environment: local                  source=console
INFO[0001] 0se: == Check scenario configurations ======================================================  source=console
INFO[0001] 0se: Scenario: sampleScenario1()              source=console
INFO[0001] 0se: Scenario: sampleScenario2()              source=console
INFO[0001] 0se: == Check scenario configurations FINISHED ===============================================  source=console
INFO[0001] 0se: == Initialize Redis ======================================================  source=console
INFO[0001] 0se: == setup() END ===========================================================  source=console
INFO[0007] 5se: Scenario sampleScenario1 is initialized. Lens is 10000  source=console
INFO[0007] 5se: Scenario sampleScenario2 is initialized. Lens is 10000  source=console
INFO[0007] 5se: == Initialize Redis FNISHED ===============================================  source=console
INFO[0007] 5se: sampleScenario2() start ID: 2, vu iterations: 1, total iterations: 0  source=console
INFO[0007] 5se: sampleScenario1() start ID: 2, vu iterations: 1, total iterations: 0  source=console
INFO[0007] 6se: sampleScenario2() end ID: 2, vu iterations: 1, total iterations: 0  source=console
INFO[0007] 6se: sampleScenario1() end ID: 2, vu iterations: 1, total iterations: 0  source=console
INFO[0007] 0se: == All scenarios FINISHED ===========================================================  source=console
INFO[0007] 0se: == Teardown() STARTED ===========================================================  source=console
INFO[0007] 0se: == Initialize Redis ======================================================  source=console
INFO[0007] 0se: == Teardown() FINISHED ===========================================================  source=console
INFO[0007] 0se: == Initialize Redis FINISHED ===============================================  source=console

     █ setup

     █ sampleScenario2

       ✓ Status is 200

     █ sampleScenario1

       ✓ Status is 200

     █ teardown

     checks.........................: 100.00% ✓ 2        ✗ 0
     data_received..................: 152 kB  25 kB/s
     data_sent......................: 939 kB  153 kB/s
     group_duration.................: avg=609.27ms min=608.9ms  med=609.27ms max=609.65ms p(90)=609.57ms p(95)=609.61ms
     http_req_blocked...............: avg=421.83ms min=421.75ms med=421.83ms max=421.91ms p(90)=421.89ms p(95)=421.9ms
     http_req_connecting............: avg=193.51ms min=193.32ms med=193.51ms max=193.71ms p(90)=193.67ms p(95)=193.69ms
     http_req_duration..............: avg=186.93ms min=186.7ms  med=186.93ms max=187.15ms p(90)=187.11ms p(95)=187.13ms
       { expected_response:true }...: avg=186.93ms min=186.7ms  med=186.93ms max=187.15ms p(90)=187.11ms p(95)=187.13ms
     http_req_failed................: 0.00%   ✓ 0        ✗ 2
     http_req_receiving.............: avg=117.5µs  min=117µs    med=117.5µs  max=118µs    p(90)=117.9µs  p(95)=117.95µs
     http_req_sending...............: avg=83.49µs  min=45µs     med=83.49µs  max=122µs    p(90)=114.3µs  p(95)=118.15µs
     http_req_tls_handshaking.......: avg=215.37ms min=215.24ms med=215.37ms max=215.51ms p(90)=215.48ms p(95)=215.5ms
     http_req_waiting...............: avg=186.73ms min=186.54ms med=186.73ms max=186.91ms p(90)=186.87ms p(95)=186.89ms
     http_reqs......................: 2       0.325413/s
     iteration_duration.............: avg=1.68s    min=906.15µs med=611.63ms max=5.52s    p(90)=4.05s    p(95)=4.79s
     iterations.....................: 2       0.325413/s
     vus............................: 2       min=0      max=2
     vus_max........................: 2       min=2      max=2

running (0m06.1s), 0/2 VUs, 2 complete and 0 interrupted iterations
sampleScenario1 ✓ [======================================] 1 VUs  0m00.6s/1m0s  1/1 iters, 1 per VU
sampleScenario2 ✓ [======================================] 1 VUs  0m00.6s/1m0s  1/1 iters, 1 per VU
Now, check the metric reception from the Datadog dashboard.
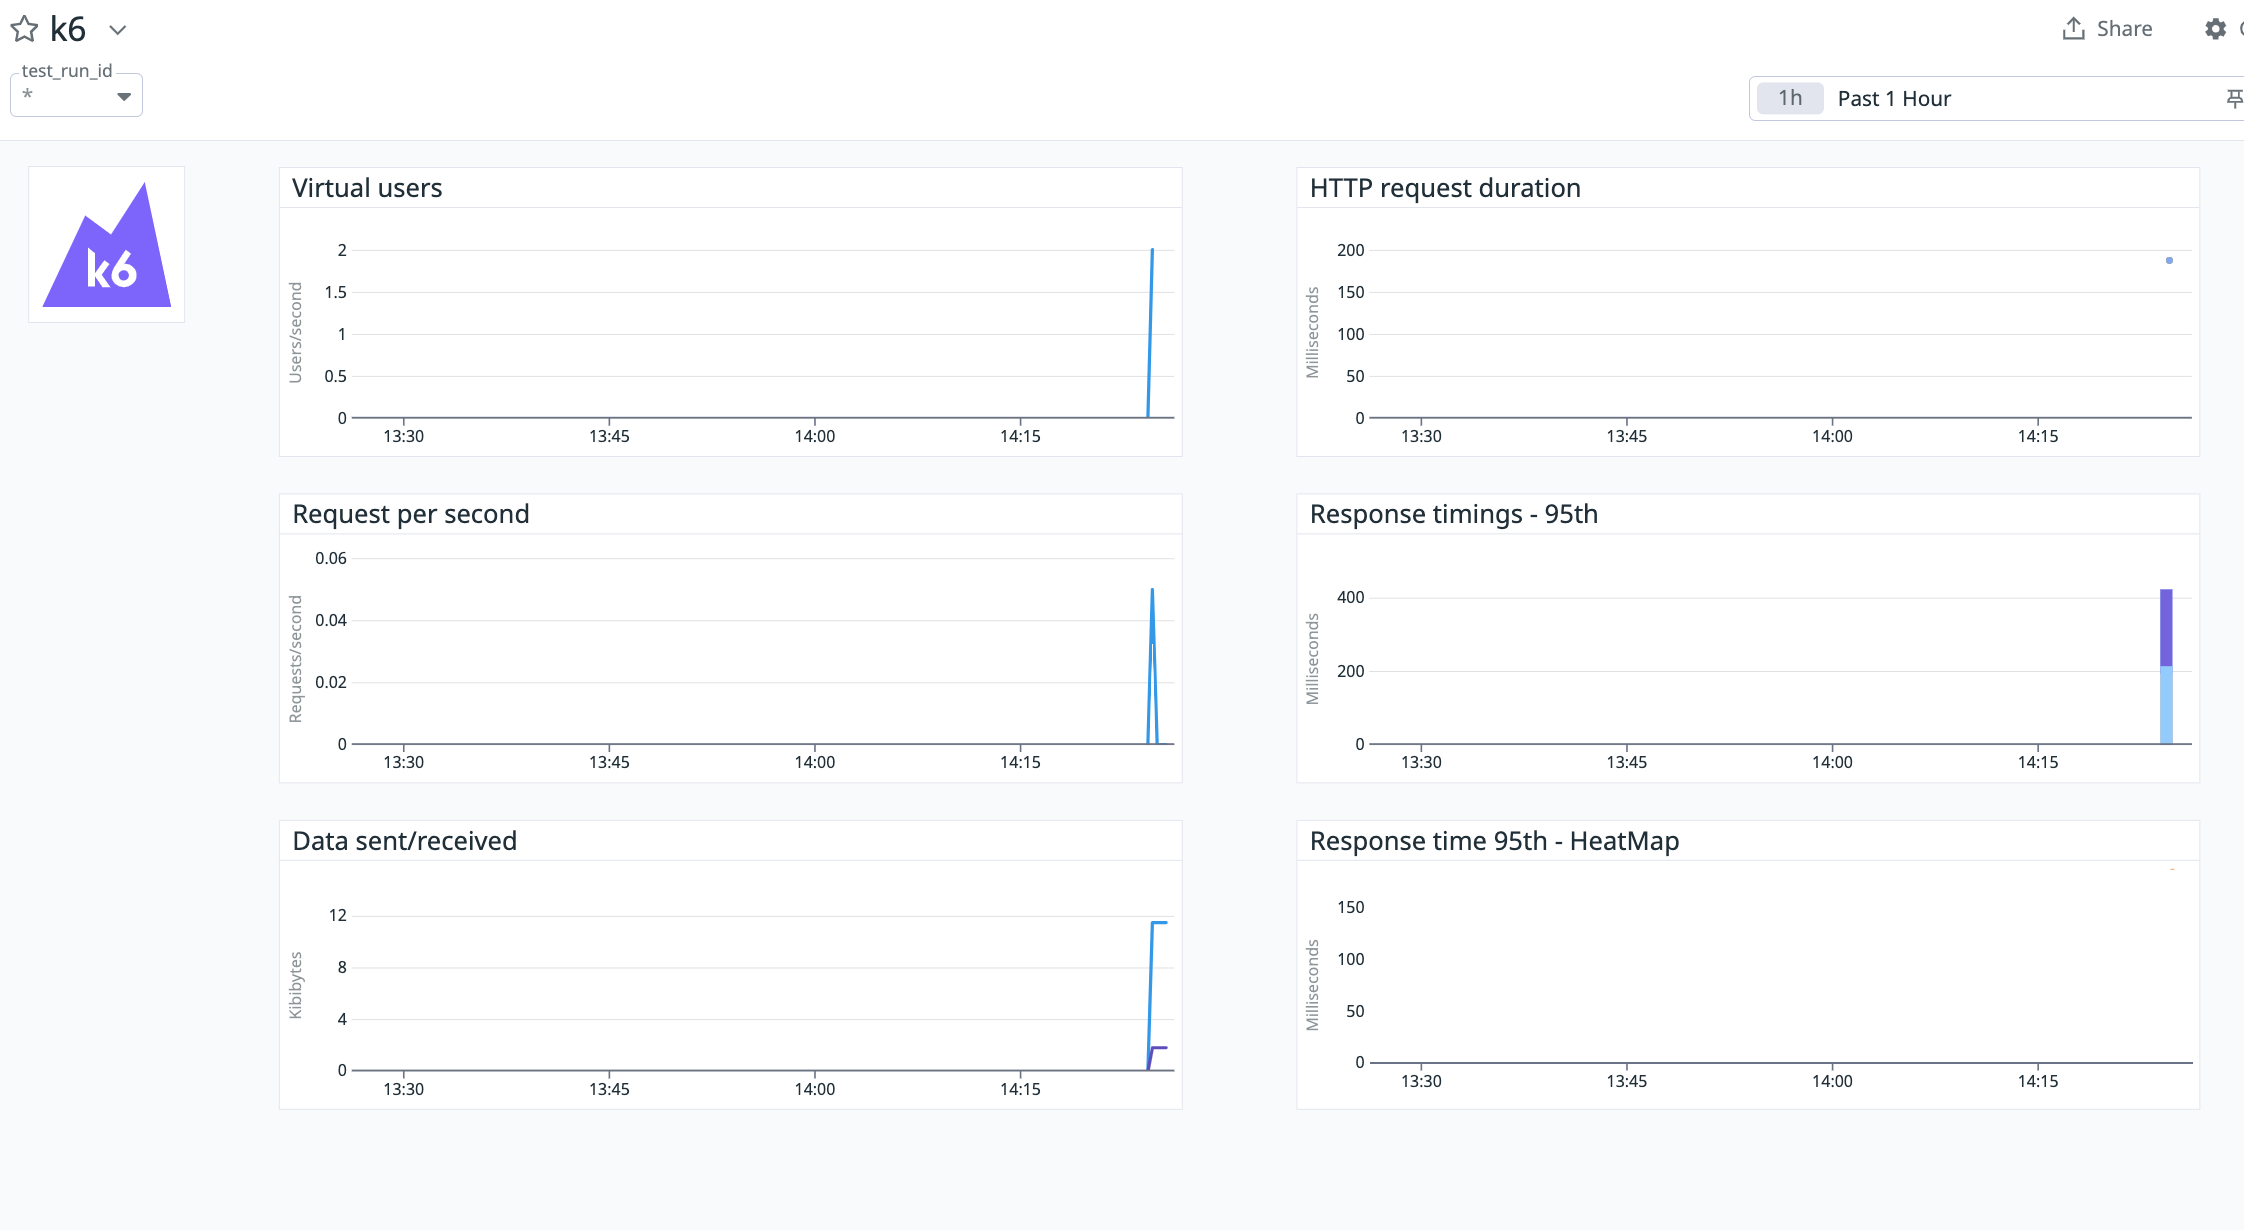
We’ve successfully integrated k6 metrics with Datadog.
Improving Usability
Tagging Load Tests
I recommend adding custom tags when sending metrics.
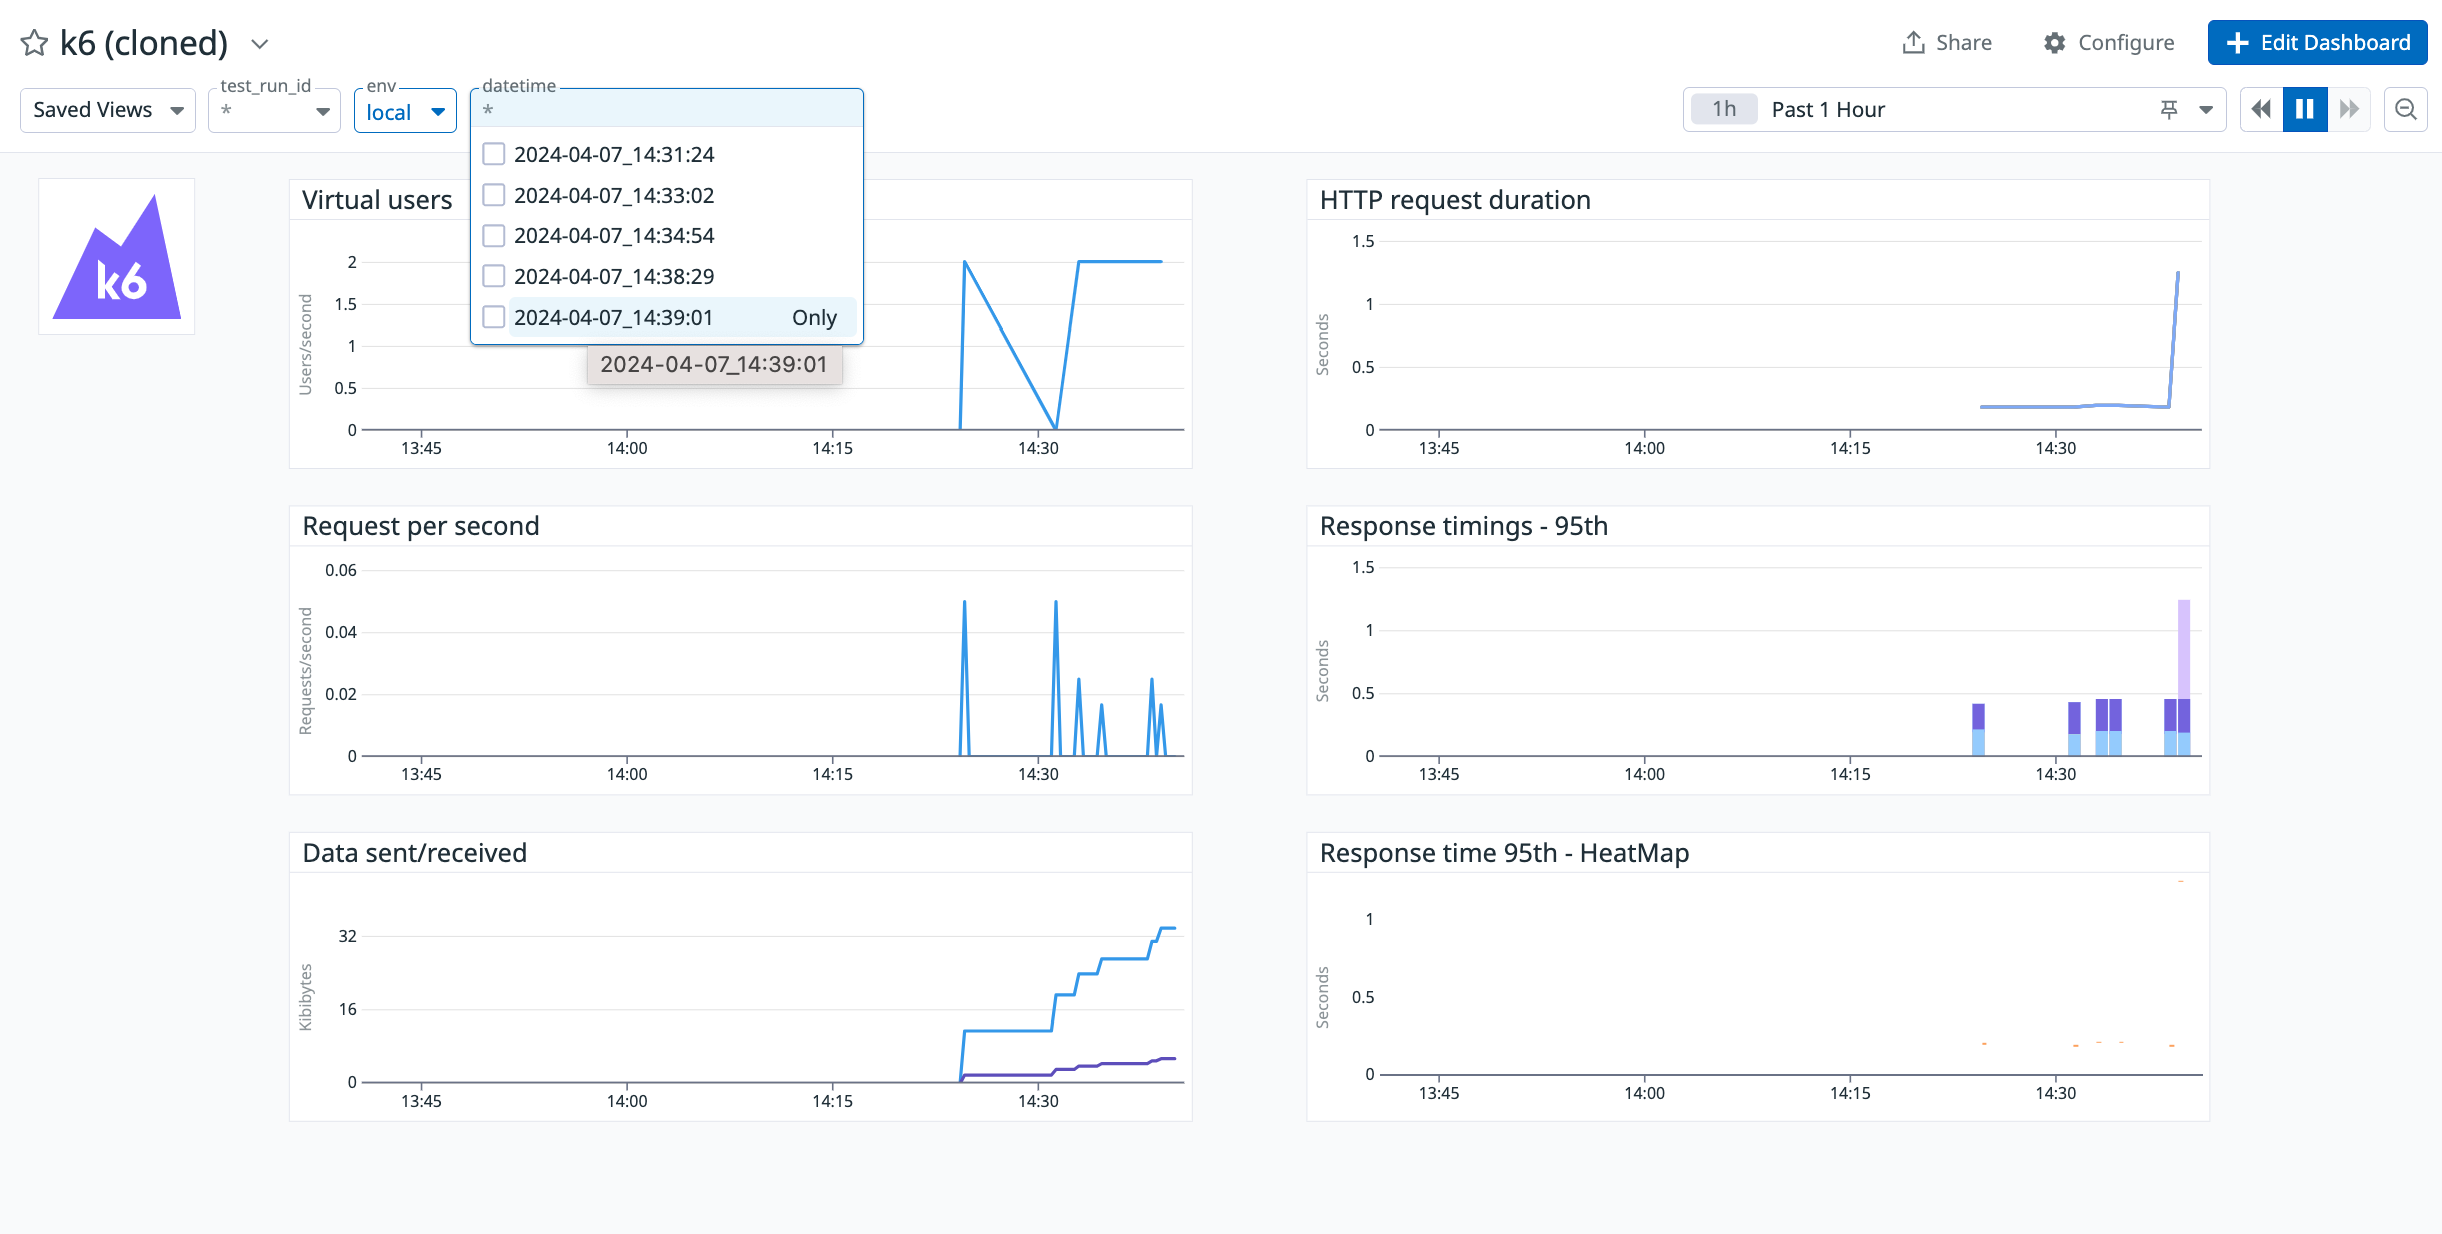
Knowing which environment and when the test was executed makes it easier to review load test results later.
tags: https://k6.io/docs/using-k6/tags-and-groups/
Simply add tags to k6 execution options as follows:
    tags: {
      env: 'local',
      datetime: formatDate(new Date()),
    },
Reference PR: https://github.com/gonkunkun/k6-template/pull/6/files
Now we can filter by env and datetime on the Datadog dashboard.
Starting with Docker Compose
Writing Docker execution commands every time can be tedious.
Let’s define everything in docker-compose.
Here, we’ll start Datadog agent and Redis with docker-compose.
version: '3.8'

services:
  datadog:
    image: datadog/agent:latest
    container_name: datadog
    volumes:
      - /var/run/docker.sock:/var/run/docker.sock:ro
      - /proc/:/host/proc/:ro
      - /sys/fs/cgroup/:/host/sys/fs/cgroup:ro
    environment:
      - DD_SITE=${DD_SITE}
      - DD_API_KEY=${DD_API_KEY}
      - DD_DOGSTATSD_NON_LOCAL_TRAFFIC=1
    ports:
      - '8125:8125/udp'

  redis:
    image: redis:latest
    ports:
      - '6379:6379'
Set environment variables.
export DD_API_KEY=xxx
export DD_SITE=ap1.datadoghq.com
Then just start it.
docker compose upConclusion
In this article, we’ve covered how to integrate k6 metrics with Datadog.
Load tests can take a long time, and monitoring metrics is essential to ensure that the test is running correctly.
Enjoy your k6 life.


