


はじめに
こんな人向けの記事
- AWS上にELK(Elasticsearch、Logstash、Kibana)の環境を構築したい
- でも無料枠の範囲内で納めたい
以前t2.microインスタンスを使って、ELKの環境構築をしたのですが、どうしてもメモリが足りずにElasticsearchが起動しませんでした。それもそのはず、t2.microインスタンスのスペックはメモリ1GBのみ。スケールアップすればいいだけの話なのですが、有料になるのでやりたくない。そんな中試行錯誤してみた結果の記事です。
結論としては、t2.microインスタンスのサーバを2台建てて、1台目のサーバにはLogstashとElasticsearch、2台目のサーバにはKibanaをインストールしました。
開発環境
- OS:Red Hat Enterprise Linux 7.6 (HVM)
- Elasticsearch 6.5
- Kibana 6.5
- Logstash 6.5
環境構築
雑なシステム構成としては以下の通りです。

EC2でインスタンスを建てます(サーバA)
Javaをインストール
sudo yum -y install java-1.8.0-openjdk java-1.8.0-openjdk-devel export
JAVA_HOME=/usr/lib/jvm/java-1.8.0-openjdk-1.8.0.191.b12-1.el7_6.x86_64

[ec2-user@ip-172-31-35-102 ~]$ java -version openjdk version "1.8.0_191" OpenJDK Runtime
Environment (build 1.8.0_191-b12) OpenJDK 64-Bit Server VM (build 25.191-b12, mixed mode)
logstashレポジトリを作成
[logstash-6.x] name=Elastic repository for 6.x packages
baseurl=https://artifacts.elastic.co/packages/6.x/yum gpgcheck=1
gpgkey=https://artifacts.elastic.co/GPG-KEY-elasticsearch enabled=1 autorefresh=1 type=rpm-md
elasticsearchレポジトリを作成
[elasticsearch-6.x]
name=Elasticsearch repository for 6.x packages
baseurl=https://artifacts.elastic.co/packages/6.x/yum
gpgcheck=1
gpgkey=https://artifacts.elastic.co/GPG-KEY-elasticsearch
enabled=1
autorefresh=1
type=rpm-md
logstash, elasticsearchをインストール
sudo yum install elasticsearch
sudo yum install logstash
サービスに登録
/usr/share/logstash/bin/system-install
sudo systemctl enable logstash
sudo systemctl enable elasticsearch
logstash, elasticsearch起動時のメモリ割り当て(重要)
# Xms represents the initial size of total heap space
# Xmx represents the maximum size of total heap space

# できれば128MBは欲しい・・・
-Xms64m
-Xmx64m
# Xms represents the initial size of total heap space
# Xmx represents the maximum size of total heap space
-Xms256m
-Xmx256m外部からのアクセスを許可(特定のIPを指定すべきですが、とりあえず動作確認のために全IPからのアクセスを許可)
network.host: 0.0.0.0
#
# Set a custom port for HTTP:
#
http.port: 9200
#
elasticsearch, logstashを起動
sudo systemctl start elasticsearch
sudo systemctl start logstash
動作確認
[ec2-user@ip-172-31-35-102 ~]$ curl http://localhost:9200
{
  "name" : "unxoSpU",
  "cluster_name" : "elasticsearch",
  "cluster_uuid" : "uqXWS77mQH2FsxeXk63yUQ",
  "version" : {
    "number" : "6.5.2",
    "build_flavor" : "default",
    "build_type" : "rpm",
    "build_hash" : "9434bed",
    "build_date" : "2018-11-29T23:58:20.891072Z",
    "build_snapshot" : false,
    "lucene_version" : "7.5.0",
    "minimum_wire_compatibility_version" : "5.6.0",
    "minimum_index_compatibility_version" : "5.0.0"
  },
  "tagline" : "You Know, for Search"
}
[ec2-user@ip-172-31-35-102 ~]$ sudo /usr/share/logstash/bin/logstash -e 'input { stdin { } } output { stdout {} }'
hello
[INFO ] 2018-12-13 09:33:37.114 [Converge PipelineAction::Create<main>] pipeline - Starting pipeline {:pipeline_id=>"main", "pipeline.workers"=>1, "pipeline.batch.size"=>125, "pipeline.batch.delay"=>50}
[INFO ] 2018-12-13 09:33:37.407 [Converge PipelineAction::Create<main>] pipeline - Pipeline started successfully {:pipeline_id=>"main", :thread=>"#<Thread:0x37addd8f run>"}
[INFO ] 2018-12-13 09:33:37.503 [Ruby-0-Thread-1: /usr/share/logstash/lib/bootstrap/environment.rb:6] agent - Pipelines running {:count=>1, :running_pipelines=>[:main], :non_running_pipelines=>[]}
The stdin plugin is now waiting for input:
{
"@version" => "1",
"@timestamp" => 2018-12-13T09:33:37.614Z,
"message" => "hello",
"host" => "ip-172-31-35-102.ap-northeast-1.compute.internal"
}
[INFO ] 2018-12-13 09:33:38.507 [Api Webserver] agent - Successfully started Logstash API endpoint {:port=>9600}
hhh
{
"@version" => "1",
"@timestamp" => 2018-12-13T09:33:45.914Z,
"message" => "hhh",
"host" => "ip-172-31-35-102.ap-northeast-1.compute.internal"
}
^C[WARN ] 2018-12-13 09:33:51.238 [SIGINT handler] runner - SIGINT received. Shutting down.
[INFO ] 2018-12-13 09:33:51.594 [[main]>worker0] pipeline - Pipeline has terminated {:pipeline_id=>"main", :thread=>"#<Thread:0x37addd8f run>"}
- EC2でインスタンスを建てます(サーバB)
Javaインストール
sudo yum -y install java-1.8.0-openjdk java-1.8.0-openjdk-devel
export JAVA_HOME=/usr/lib/jvm/java-1.8.0-openjdk-1.8.0.191.b12-1.el7_6.x86_64
kibanaレポジトリを作成
[kibana-6.x]
name=Kibana repository for 6.x packages
baseurl=https://artifacts.elastic.co/packages/6.x/yum
gpgcheck=1
gpgkey=https://artifacts.elastic.co/GPG-KEY-elasticsearch
enabled=1
autorefresh=1
type=rpm-md
kibanaインストール
sudo yum install kibanaサービス登録
sudo systemctl enable kibana接続先設定
# To allow connections from remote users, set this parameter to a non-loopback address.
server.host: "0.0.0.0"

# The URL of the Elasticsearch instance to use for all your queries.
elasticsearch.url: "http://[サーバAのIPアドレス]:9200"
kibana起動
sudo systemctl start kibanakibanaの動作確認をしたいところですが、まだできないです。
PCやELKが各サーバ間で接続できるように、ポートを開けます。
開けるポートのイメージは以下の通りです。

※もしかしたら20番ポートは開ける必要ない
EC2のコンソール画面からSecurity Groupsを選択
サーバAのセキュリティグループを選んで、「Edit」を押す
- TCPの9200番ポート(elasticsearch用)を開けます。SourceではサーバBのIPアドレスを入力してください
サーバBのセキュリティグループを選んで、「Edit」を押す
- TCPの20番ポートと5601番ポート(Kibana用)を空けます
動作確認のために、すべてのIPアドレスからのアクセスを許可していますが、セキュリティガバガバなので、実際に使うときには気をつけてください
改めて動作確認
サーバBからサーバAのElasticsearchへ繋いでみる
[ec2-user@ip-172-31-34-0 ~]$ curl [サーバAのIPアドレス]:9200
{
"name" : "unxoSpU",
"cluster_name" : "elasticsearch",
"cluster_uuid" : "uqXWS77mQH2FsxeXk63yUQ",
"version" : {
"number" : "6.5.3",
"build_flavor" : "default",
"build_type" : "rpm",
"build_hash" : "159a78a",
"build_date" : "2018-12-06T20:11:28.826501Z",
"build_snapshot" : false,
"lucene_version" : "7.5.0",
"minimum_wire_compatibility_version" : "5.6.0",
"minimum_index_compatibility_version" : "5.0.0"
},
"tagline" : "You Know, for Search"
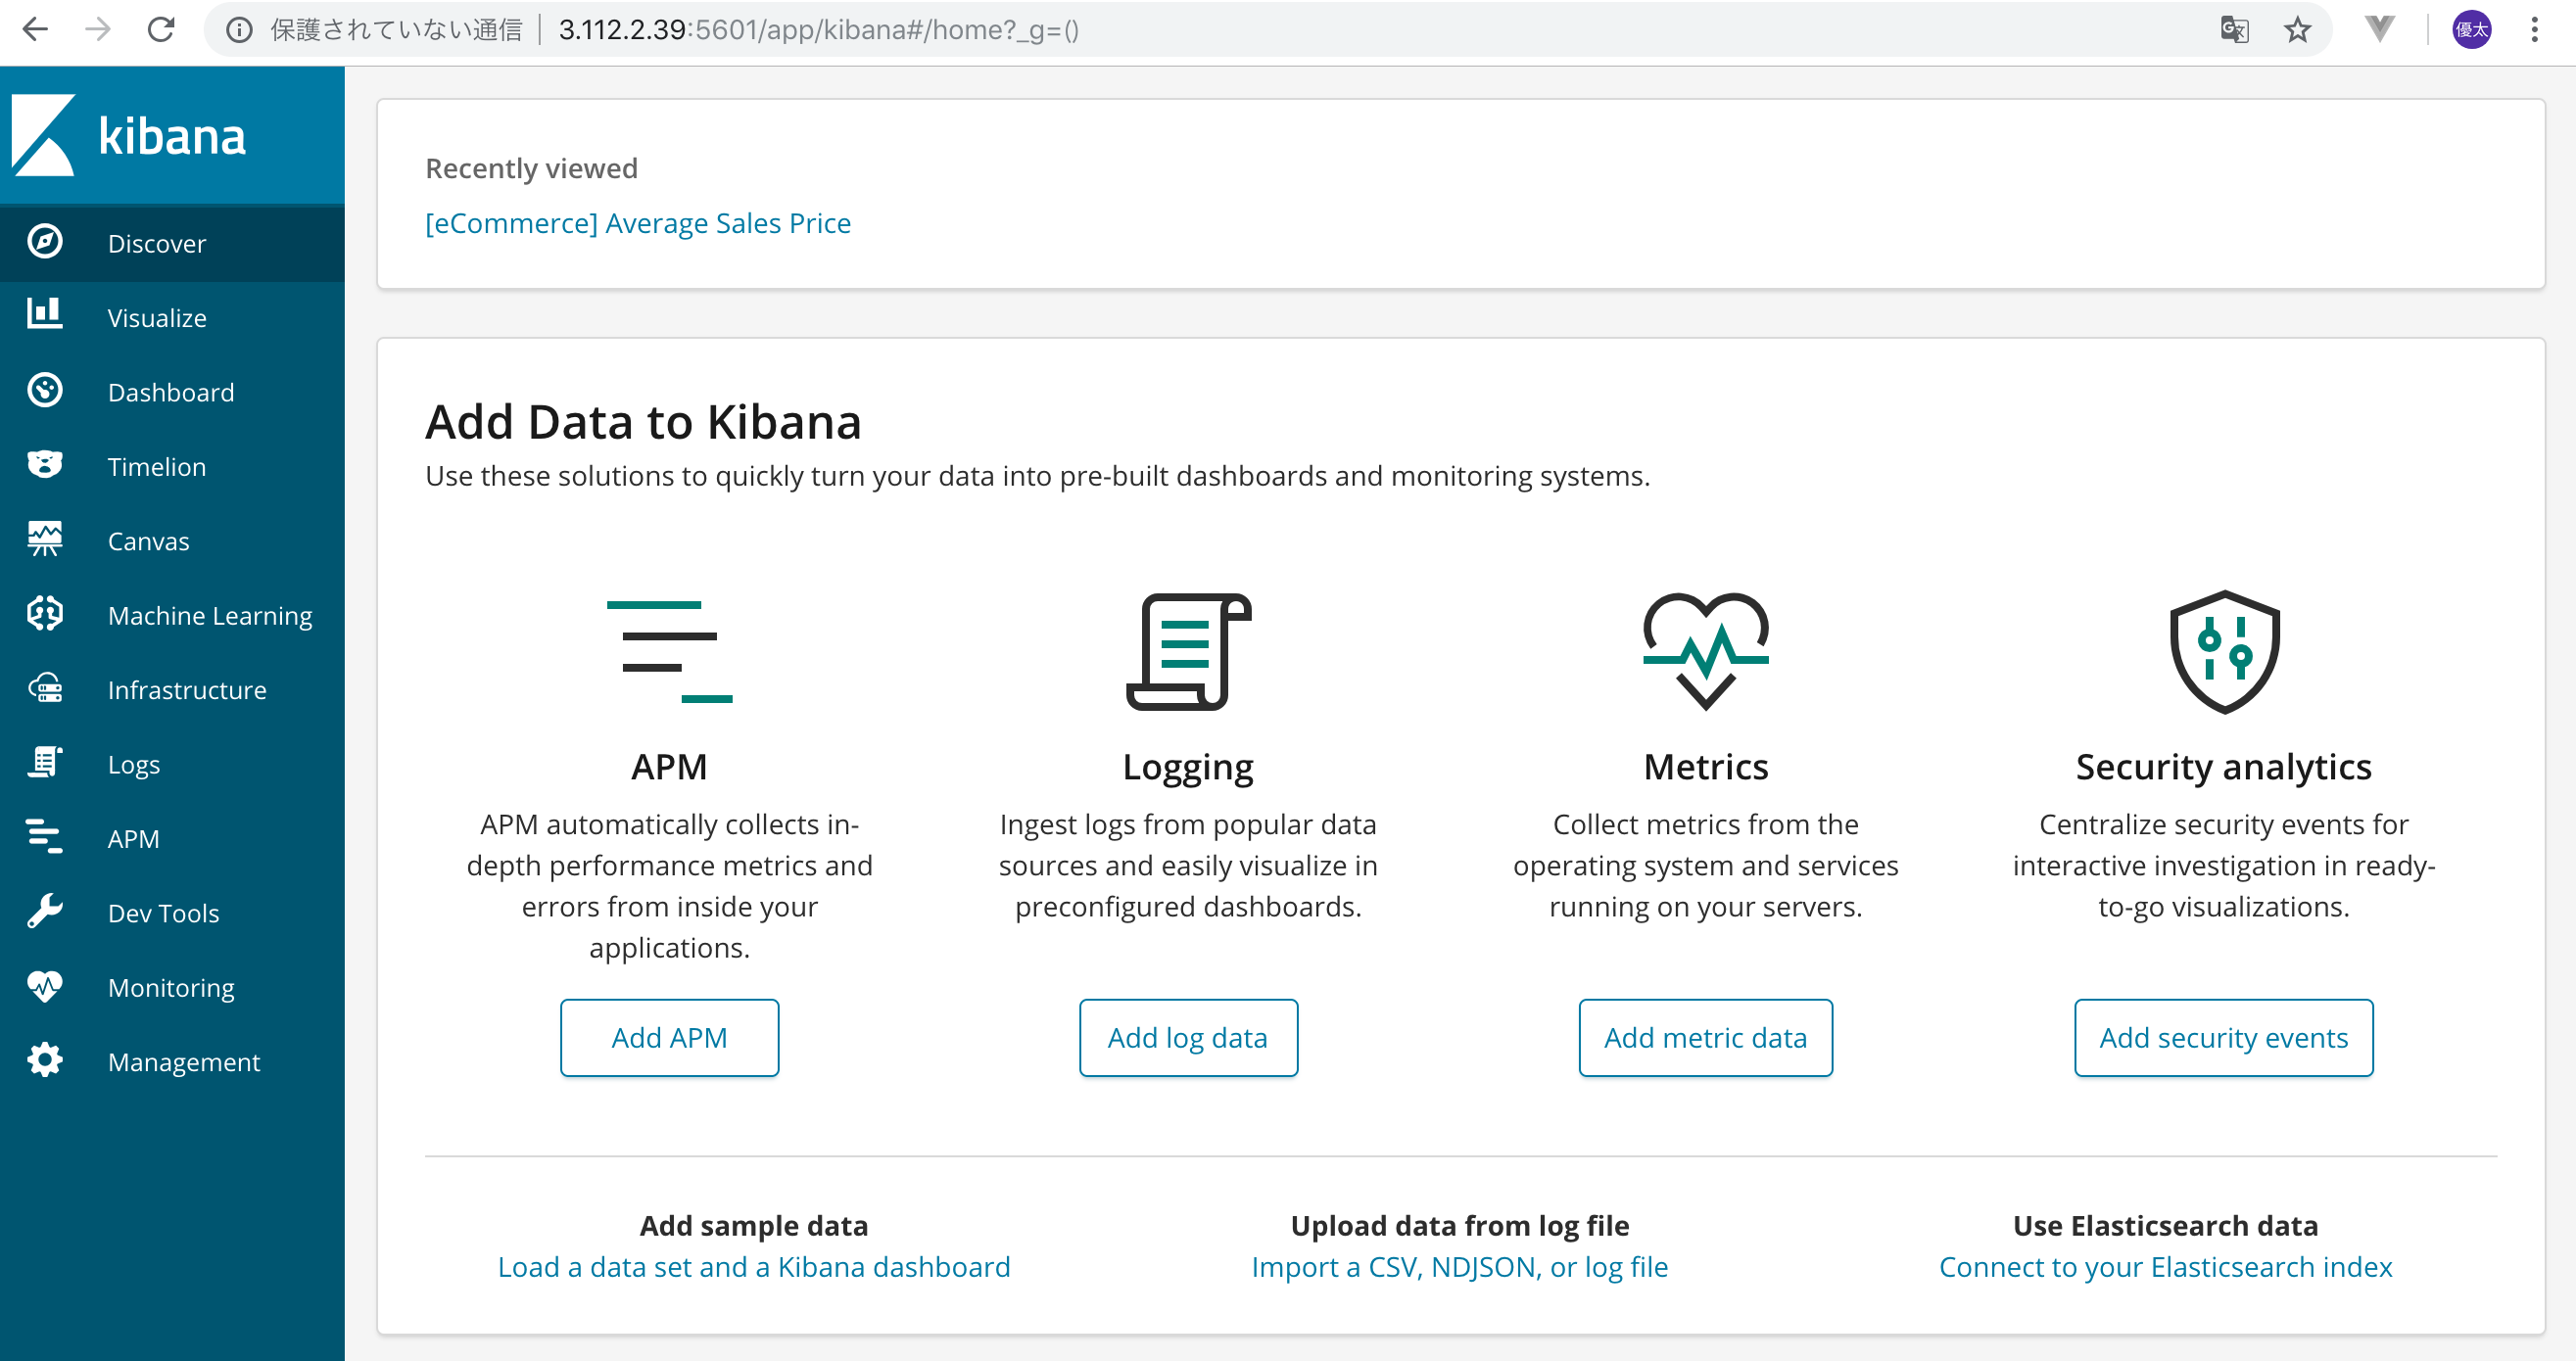
}手元のPCからサーバBのKibanaへ繋いでみる
接続先:http://[サーバBのIPアドレス]:5601/
この画面が表示されれば完了です
終わりに
今回は無料枠の範囲内でELK環境構築をしました。このサーバをベースに様々なデータを突っ込んでいきましょう
ところどころ端折っていたので、ちょこちょこ追記していきます